Jim Mimlitz, NRI
Water Utility Pumping Stations and Filtration Plants are heavily reliant upon the electric power grid, and therefore it is often desirable to closely monitor the quality of the incoming power. As a general rule, NRI has always offered basic power fault tracking at all Telemetry-monitored stations. However, at certain critical stations, it is desirable to acquire more detailed information regarding the power grid.
Consequently, it has not been unusual for our Water Utility clients to field calls from Electric Utility service personnel inquiring about the status of their power grid in the vicinity of Telemetry/SCADA-monitored water pumping stations.
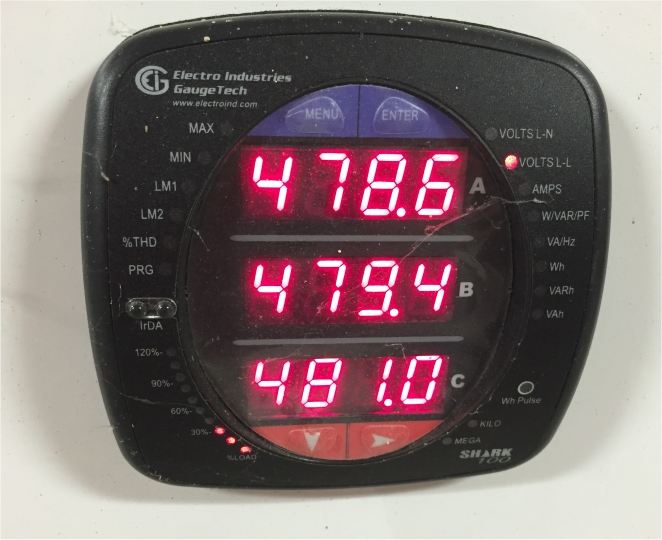
A proven power-monitoring instrument that Navionics Research has successfully utilized in the past is the Shark 100, manufactured by Electro Industries Gaugetech (Westbury, NY). The Shark 100 is a 0.2% accuracy-class multi-functional power meter that offers the ability for a connected Telemetry/SCADA System to monitor:
- Voltage, 3-Phase, L-L
- Voltage, 3-Phase, L-N
- Current
- Watts
- Wh
- VA
- VAh
- Power Factor
- Frequency
- Total Harmonic Distortion

Shark 100 Power Meter, by Electro Industries/GaugeTech.
A 3-phase power meter installation generally consists of probing each of the three (3) legs of the incoming utility power for voltage, plus monitoring the current through the three (3) legs via wrap-around coils, usually referred to as CT’s (current transformers). In order to collect the broadest information possible, an RS-485 Modbus/RTU connection is desirable.
Shark 100 Installed within a Control Panel Cutout.

Behind-the-Door Wiring: Modbus (RS-485), 3-Phase Voltage, 3-Phase Current.

One of Several Possible Wiring Diagrams (from the EIG Shark 100 Manual).
Once installation and Telemetry/SCADA integration is completed, the Water Utility is able to monitor the status of the incoming voltages in realtime:

Realtime Monitor of L-L Voltages
High-Alarm and Low-Alarm Thresholds can be defined, so that the Water Utility can be immediately notified of any anomalies:

Telemetry Low-Voltage and High-Voltage Alarm Thresholds.
The Telemetry/SCADA History Chart below is from a pumping station; and it illustrates a normal 480VAC/3-Phase voltage trend, until a single phase was lost at 21:10:34, Mar 17 2017. The C-A voltage was normal through the power fault, which conveys that one of the three phases was missing (the B-leg).

History Trend Chart. Note the Phase Fault Occurrence (Phase B Lost) at 21:10:34.
Are you interested in implementing advanced 3-Phase Voltage and Power Monitoring capability at one or more of your critical pumping or water treatment stations? We offer experience providing this feature — and many more. Give us a call, and we’ll be glad to discuss this with you in further detail.
Telemetry, SCADA, & Controls Newsletter
Was this article helpful? Would you be interested in receiving updates such as these in our occasional email-delivered newsletter? If so, here’s our sign-up page:
Subscribe to Navionics Research’s “Telemetry, SCADA, & Controls Newsletter”