Jim Mimlitz, NRI
Key to Energy Efficiency: Reduction of Friction Losses
In order to explain the pump station energy savings, let’s return to the automobile analogy. Why does an automobile achieve better gas mileage at moderate speeds than high speeds? Isn’t it possible to just introduce a few higher gear ratios (6th gear… 7th gear) so that the engine maintains the same RPM’s and MPG fuel consumption at higher speeds? The answer is NO — and the reason is rooted in friction or “drag”. Because drag force increases as the square of the speed (and drag power increases as the cube of speed), cutting the speed in half, for example, decreases friction force by a factor of four (and decreases friction power by a factor of 8).
Keep in mind, though, that cutting the speed in half would require the car to run twice as long at 1/8 power — so the friction losses decrease overall by a factor-of-4.
In a water distribution system, drag losses mainly occur between the flowing water and the inner pipeline surfaces, but the same principle applies: drag force increases as the flow velocity squared. For example, cutting the pump flow rate in half will reduce accumulated friction losses by a factor of four. It is here — the reduction of friction losses — where substantial energy savings may be hiding within a water utility — and waiting to be discovered.

Friction Losses Increase as the Square of the Velocity.
VFD’s and Pump Speed Control
In order to control the flow velocity, the pump speed must be controlled with a VFD — a Variable Frequency Drive. And what is a VFD? It is a type of motor controller that varies the frequency and voltage supplied to the electric motor. Other names for a VFD are variable speed drive, adjustable speed drive, adjustable frequency drive, AC drive, microdrive, and inverter. In pump station applications, VFDs can be used to provide variable-speed pumping operation, as well as to provide slow ramp-up starts and slow ramp-down stops. If you are interested in reading a more in-depth explanation of VFD technology, please visit the wikipedia reference:
http://en.wikipedia.org/wiki/Variable-frequency_drive
Innovative VFD / Telemetry Integration
Over the past 19+ years at NRI, we have developed innovative VFD/Telemetry integration techniques through dozens and dozens of variable-speed pumping projects. In the process, our techniques have pushed the state-of-the-art in Rural and Municipal Water control technology. We have helped water utilities:
- Eliminate Pump-Induced Water Hammers
- Achieve Discharge-Pressure-Limiting Pump Speed Control
- Achieve Suction-Pressure-Sustaining Pump Speed Control
- Implement Water-Tower-less (Demand-Based) Pumping Systems
- Implement Emergency-Supply Pumping Systems Capable Of Automatically Sensing Fire-Flows And Increasing The Pump Speeds To Satisfy The Temporary Emergency Demand
Navionics Research Partners with Rockwell Automation for Variable Frequency Drives
In order to achieve an even higher level of effectiveness, it became apparent that a more sophisticated VFD was required. So when recently presented with the latitude to select from the multitude of VFD vendors, we seized the opportunity to step up to a top-tier VFD.
NRI is extremely pleased and excited to announce a new Reseller and Systems Integration Partnership with Rockwell Automation / Allen Bradley (Milwaukee, Wisconsin USA, NYSE:ROK). Effective immediately, NRI will be offering seamless integration of Rockwell Automation’s elite family of PowerFlex® Variable Frequency Drives (VFDs) into all of our new and existing Telemetry, SCADA, and Control systems.
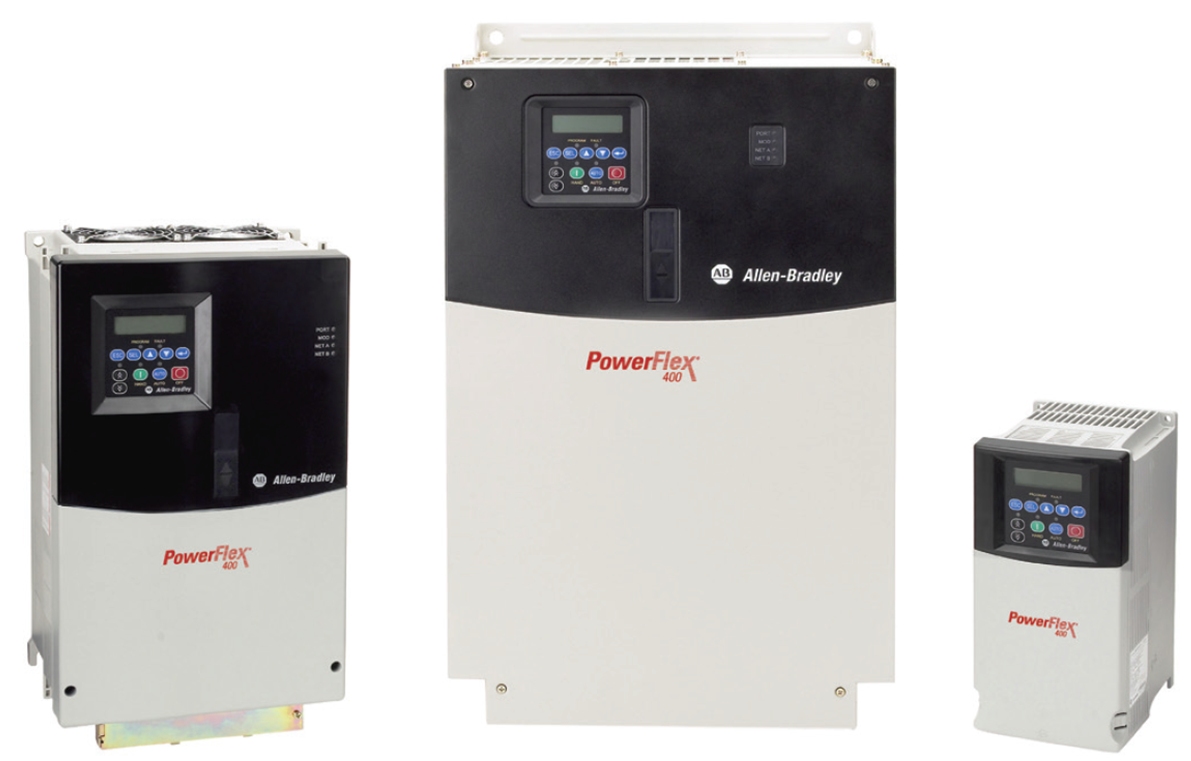
Rockwell Automation / Allen Bradley PowerFlex®
Variable Frequency Drive Family
Our partnership with Rockwell Automation and its PowerFlex VFD has allowed us to offer significant new advantages to you, our customer:
- Extremely Well-Designed, Durable VFD
- Easy-to-Navigate, Intuitive Keypad Interface
- Utilizes Industry-Standard Networking Protocols (Modbus, DF1, EtherNet/IP) — No Unstable, Proprietary Networking Protocols
- New! – Seamless Integration with Navionics Research’s New Energy & VFD Analytics Package
- Wide Range of Compatible Accessories, Including Line Reactors, Load Reactors, and Terminators
- Variety of Standard, Ready-Made Packages, Including NEMA-3R Outdoor Units, etc…
- Usually Same-Day or Next-Day Availability
- Local Stocking Distributor — French Gerleman — in Missouri (St. Louis, Washington, Columbia, KC) and Illinois (Quincy)
- National Distribution Centers Open 24 Hrs/Day: Champaign IL and Memphis TN
- Advanced Repair/Replacement Program
- Aggressive Pricing
- Manufactured by an American Company (NYSE: ROK)
- VFD Internal Software and Documentation Written by USA Engineers
A Pump Station Application Story…
As a validation of our new approach, we recently appreciated the opportunity to complete a PowerFlex VFD & Telemetry upgrade at long-time client Williamsville, Illinois. Williamsville’s SCADA system, which was originally installed in 2000, includes two water towers, two pumping stations, a ground storage tank, and a C3 SCADA Server.
Despite the presence of motor soft starters in the stations, the distribution system still suffered from significant water pressure hammers, which can weaken and/or rupture distribution mains. To alleviate this problem and reduce energy costs, the soft starters in the booster pumping station were replaced with 25HP Allen Bradley PowerFlex 400 VFD’s and Load Reactors. Furthermore, as an added bonus, NRI’s VFD & Energy Analytics Package was flashed into the existing RTU to assist with energy analysis and reduction.

Booster Pump Station at Williamsville IL – Outside View

Booster Station at Williamsville Illinois – Inside View

Kent Thompson, Williamsville Director of Public Works: Specifying The Desired Wall-Mount Location

Installation Complete: Pump Circuit Breaker / Load Reactor Panels (Left).
New PowerFlex 400 Variable Frequency Drives (Right).
VFD & Energy Analytics Package
This software package — which is compatible with the existing RTU hardware — includes digital, two-way network communication with the VFD. When added to the Telemetry controls, this software provides the client with detailed monitoring and optimized control of the pumps:
- Electricity Bill Minimization — Ability to Visualize Pump “Gallonage” In Realtime (GPK)
- Speed Control (%)
- Acceleration Rate Control (%/sec)
- Deceleration Rate Control (%/sec)
- Speed Monitoring (%)
- Bus Voltage Monitoring (VDC)
- Output Voltage Monitoring (VAC)
- Output Current Monitoring (Amps)
- Output Power Monitoring (KiloWatts)
- Accumulated Energy Consumption Monitoring (KiloWatt-Hours)
- VFD Internal Temperature (Heat Sink) Monitoring (deg F)
- Pump Efficiency Monitoring (%)
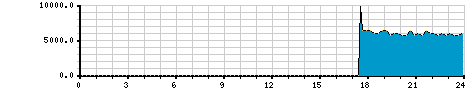
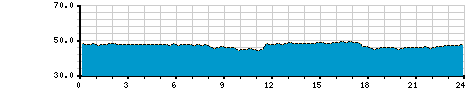
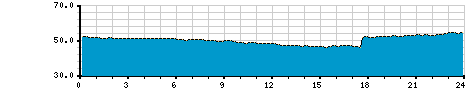
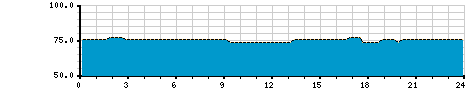
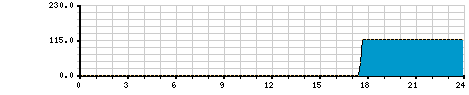
After the installation of the VFD upgrade, the Energy & VFD Analytics Package populated the SCADA historical trending charts with the following data:
Pump Status (ON/OFF) – 24 Hour History Chart (above)
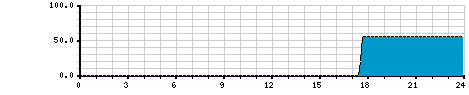
VFD Output Speed (%) – 24 Hour History Chart (above)
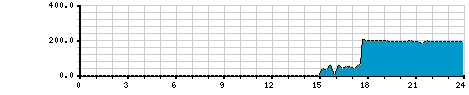
Flow Rate (GPM) – 24 Hour History Chart (above)

VFD Output Power (KW) – 24 Hour History Chart (above)
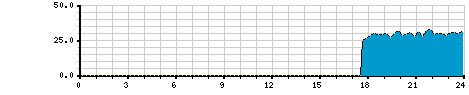
Pump Efficiency (%) – 24 Hour History Chart (above)
Pump “Gallonage” (GPK) – 24 Hour History Chart (above). Note that the GPK can spike up during pump ramp-up and ramp-down — This is normal.
Pump Suction Pressure (PSIG) – 24 Hour History Chart (above)
Pump Discharge Pressure (PSIG) – 24 Hour History Chart (above)
VFD Temperature (degF) – 24 Hour History Chart (above)

VFD Bus Voltage (VDC) – 24 Hour History Chart (above)
VFD Output Voltage (VAC) – 24 Hour History Chart (above)

VFD Output Current (A) – 24 Hour History Chart (above)
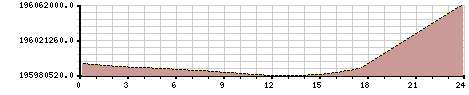
Flow Meter Totalization (Gallons) – 24 Hour History Chart (above)
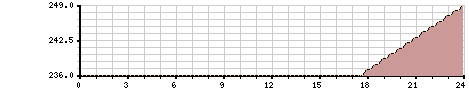
VFD Total Power Consumption (kwh) – 24 Hour History Chart (above)

VFD Fault Codes – 24 Hour History Chart – No Faults (above)
The most important and innovative energy information produced by the VFD & Energy Analytics Package is our “Pump Gallonage” metric, which tracks a running Gallons/KWH (GPK) figure. The pump station RTU re-calculates this figure every few seconds as follows:
"Gallonage"(GPK) = FlowRate(gal/hour) / MotorPower(kw)
Utilizing power measurement equipment combined with a SCADAmetrics EM-100 EtherMeter Flow Meter Gateway, a baseline energy and flow assessment was performed before installation of the VFD’s, yielding the following measurements:
- Average Rate-of-Flow: 352.3 GPM
- Average Power Consumption: 15.918 KW
- Average Pump Gallonage: 1328 GPK


After the installation of the new VFD’s and re-flashing the RTU with NRI’s new VFD & Energy Analytics Package, energy optimization was begun. Over the course of the next several weeks, key telemetry setpoints (relating to pressure limits and pump speed limits) were varied to achieve an optimal balance between average pump speed and GPK.
The optimal average VFD speed of 60% (36 Hz). Telemetry History charting the VFD & Energy Analytics provided the following performance summary:
- New Average Rate-of-Flow: 169.34 GPM
- New Average Power Consumption: 2.519 KW
- New Average Pump Gallonage: 4033 (GPK)
By plugging in the cost of a KWH (approximately $0.12 in 2015 Illinois), the energy cost and savings were easily calculated:
- 100% Speed (No VFDs): 1328 (GPK) / 0.12 (Dollars/KWH) = 11,067 Gal/Dollar
- 60% Speed (With VFDs): 4033 (GPK) / 0.12 (Dollars/KWH) = 33,608 Gal/Dollar
![]()
Since the booster station averages about 3.82 MGal/Month, the energy costs and savings were also easily calculated:
- 100% Speed (No VFDs): 3,820,000 (Gal/Month) / 11,067 (Gal/$) = $345/Month
- 60% Speed (With VFDs): 3,820,000 (Gal/Month) / 33,608 (Gal/$) = $114/Month
- Energy Savings: $231/Month or $2772/Year — (67%)
The bottom line is that this client realized an energy consumption decrease of 67%. Please note that your savings may be more or less, as every application is unique.
As an additional resource, Rockwell Automation offers a useful tool in the form of an online energy savings calculator.
Is your interest still piqued? There are, in fact, even more advantages to our new VFD & Energy Analytics Package.
In the next installment of this article, we will discuss the following benefits:
- VFD Fault Alarming and Remote Reset
- Water Hammer Elimination
- VFD Temperature Monitoring and Alarming
- VFD Health Monitoring and Alarming
- VFD Network Communications
- VFD Terminal Block (Backup) Controls
- Faster-than-100% Pump Speed
- Utility Rebates
- Power Factor Correction
- 3-Phase Power Generation From Single-Phase Power
Tune in tomorrow for the 3rd and final installment! LINK TO PART 3
Telemetry, SCADA, & Controls Newsletter
Was this article helpful? Would you be interested in receiving updates such as these in our occasional email-delivered newsletter? If so, here’s our sign-up page:
Subscribe to Navionics Research’s “Telemetry, SCADA, & Controls Newsletter”
Pingback: Introducing VFD & Energy Analytics for Telemetry, SCADA, and Control Systems — Prologue | Wireless Telemetry
Pingback: Introducing VFD & Energy Analytics for Telemetry, SCADA, and Control Systems — Part 1 of 3 | Wireless Telemetry
Pingback: Introducing VFD & Energy Analytics for Telemetry, SCADA, and Control Systems — Part 3 of 3 | Wireless Telemetry