Jim Mimlitz, NRI

Levee Pump Station
The automatic measurement of this data poses several challenges to the Telemetry Engineer: Typical flow meters in the potable water industry consist of a turbine or propeller suspended within the flow tube. However, pumped ditch water contains a high percentage of solids, such as branches, leaves, debris, etc.. Thus mechanical flow meters, whose moving parts could clog the pipeline and restrict flow, should be ruled out as a source of reliable flow data.
Inline magnetic flow meters are very accurate and have no moving parts, and are therefore the measurement instrument gold standard for this application. However, the equipment and installation costs of an inline flowmeter can be considerable and often not in-line with a project’s budget.
NRI was recently tasked with monitoring pump flow-rate and totalization at two Levee Districts using computerized estimation techniques. The goal was to provide reasonably-accurate flow rate and totalization, yet without the expense of acquiring and installing inline magnetic flowmeters.
One crude method would have been to simply assume a typical flow rate, and scale the pump runtime accordingly to estimate total pumped volume. However, this method would fail to take into account changing hydraulic conditions. For example, if the river level was high, the true pump flow rate would decrease due to an increased static head. Alternatively, if the ditch level was high, the true pump flow rate would increase due to a decreased static head.
In the course of these two projects, Mechanical Engineer John Neyens, PE at Klingner & Associates (Quincy, IL) requested that a more sophisticated estimation technique be employed — one that takes into account the specific characteristics of the pump (the pump curve) as well as the dynamic hydraulic characteristics, which vary based upon the ditch and river levels (the system curve). The meanings of these curves, and their interrelationships, are well-described at engineeringtoolbox.com.
The following equations, provided by Neyens, describe one of the levee pumps and its associated hydraulic system:
System Curve:
TDH = (1.509690E-9)*F^2 + (4.40974568E-6)*F + (SH)
Pump Curve:
TDH = (-146.217E-15)*F^3 + (-1.830671155E-9)*F^2 + (-139.47674085E-6)*F + (52.768)
where
TDH = Total Dynamic Head
F = Flow Rate (Gallons Per Minute)
SH = Static Head
The flow rate is calculated by solving for the root(s) of the following non-linear equation:
TDH (Pump Curve) – TDH (System Curve) = 0
(-146.217E-15)*F^3 + (320.98115E-12)*F^2 + (-143.88648E-6)*F + (52.758-SH) = 0
The above equation may have multiple roots, so the solution should be bounded within a reasonable range.
Solving cubic equations using iterative, non-linear techniques is generally beyond the capability of most industrial automation controllers. However, this is an area where the computational power of Navionics Research’s RTU (IBM-compatible PC architecture) can be leveraged. In this project, our RTU utilizes the secant method of solution convergence to update the rate-of-flow in Gallons-Per-Minute every 5 seconds. The total pumped volume was also continuously updated using discrete calculus (the time integral of the flow-rate) — thereby providing totalization in Gallons.
It is important to note that this solution requires knowledge of the Static Head, which requires instantaneous telemetry measurements of the water levels in both the ditch and in the river. This was achieved using Navionics Research’s Pneumatic Bubbler System, which is described in another article here on our website.
The following Telemetry History Charts from a Levee District’s SCADA System illustrate the results of this effective technique:
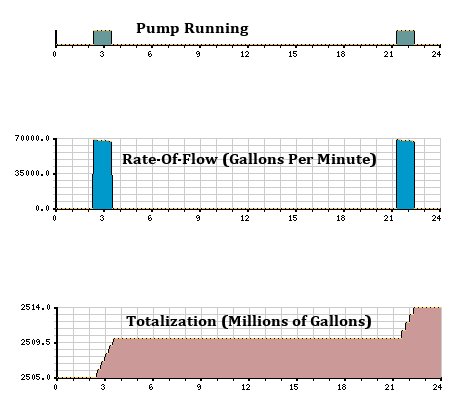
Telemetry History Charts from a Levee District’s SCADA System, Illustrating the Results of the Automatic Calculation of Rate-of-Flow and Total Gallons Pumped.
Would this type of sophisticated flow calculation benefit your Levee District or potable water system? Give us a call. Our Telemetry/Control Systems are designed to leverage this exciting technology; and we’ll be glad to discuss this with you in further detail.
Telemetry, SCADA, & Controls Newsletter
Was this article helpful? Would you be interested in receiving updates such as these in our occasional email-delivered newsletter? If so, here’s our sign-up page:
Subscribe to Navionics Research’s “Telemetry, SCADA, & Controls Newsletter”
Pingback: Levee District Control: Ditch and River Level Sensing | Wireless Telemetry